Using ggplot2
Load library:
library(ggplot2)
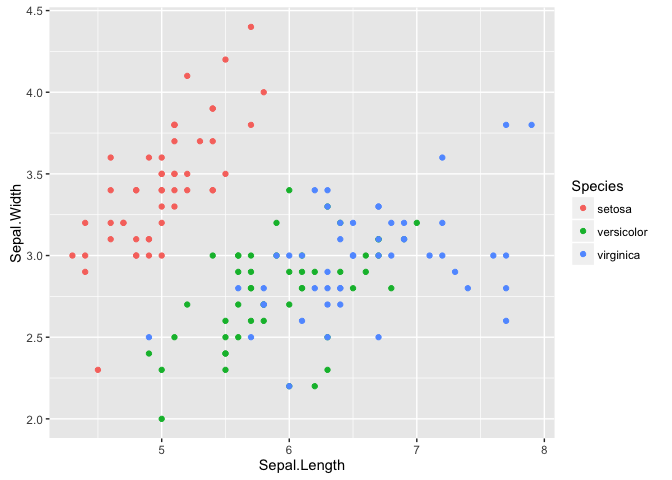
Scatter plot:
data(iris)
ggplot(iris, aes(x=Sepal.Length, y=Sepal.Width)) +
  geom_point(aes(colour=Species))
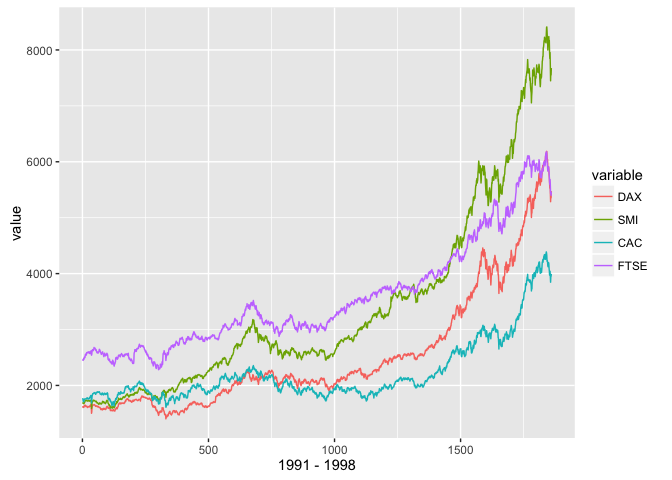
Line graph:
data(EuStockMarkets)
df <- as.data.frame(EuStockMarkets)
df$x <- 1:nrow(df)
library(reshape2)
df_melt <- melt(df, id.vars = 'x')
ggplot(df_melt, aes(x=x, y=value)) +
  geom_line(aes(colour=variable)) +
  xlab('1991 - 1998')
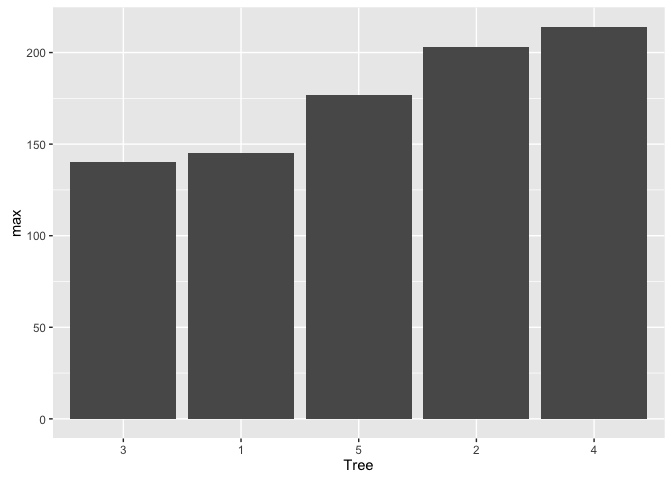
Bar graph:
data(Orange)
library(dplyr)
##
## Attaching package: 'dplyr'

## The following objects are masked from 'package:stats':
##
##     filter, lag

## The following objects are masked from 'package:base':
##
##     intersect, setdiff, setequal, union
ggplot(group_by(Orange, Tree) %>% summarise(max = max(circumference)), aes(x=Tree, y=max)) + geom_bar(stat="identity")
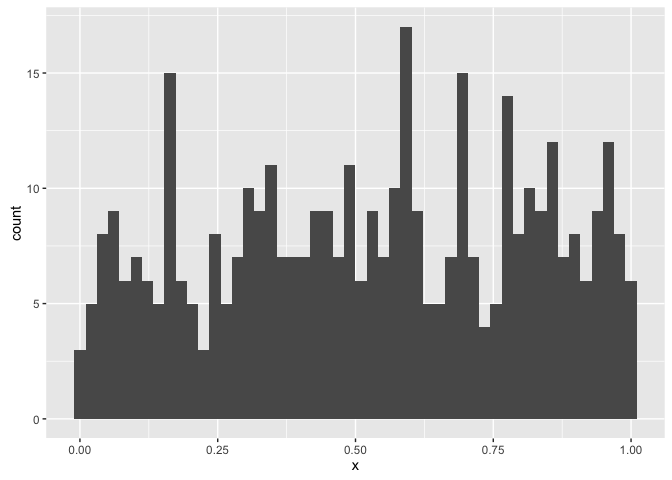
Histogram:
data(randu)
ggplot(randu, aes(x=x)) + geom_histogram(bins = 50)
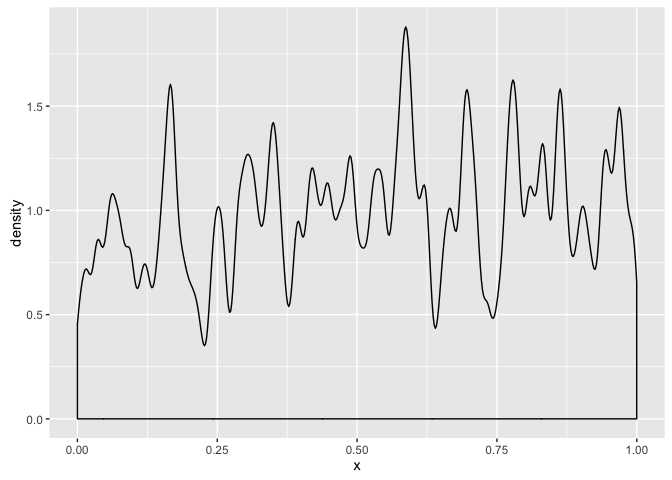
Density plot:
data(randu)
ggplot(randu, aes(x=x)) + geom_density(adjust=0.1)
blog comments powered by Disqus